Keeping abreast of the financial position of your company is a must for any small business owner. One of the most crucial reports for you to review on a regular basis is the Profit & Loss Report. In QuickBooks, you will find this report by clicking on Reports>Company and Financial>Profit & Loss (Standard or Detail). For this report, we will use the Standard version. Be aware that you can double-click on any of the dollar amounts to find the detail about that particular figure.
The report defaults to This Month-to-Date, but is easy enough to set to any period that you would like to view such as This Fiscal Year or This Fiscal Quarter (we will use This Fiscal Year). You also have several options for viewing by columns, such as by month, year, or customer:job.
The top of the Profit & Loss report shows your company’s Income for the selected period, and is listed in order by Income Account. The next section – if applicable – is the Cost of Goods Sold section. Here you will find COGS line items followed by their total and the resulting Gross Profit calculation (deducting the Total COGS with the Total Income from the section above it). Following the COGS section is the Expense section. Again, the Expenses are listed in order of Expense Account, and are totaled at the bottom of the section. The calculation continues here, and you find the Net Ordinary Income (Total Income – Total COGS – Total Expense = Net Ordinary Income). Finally, Other Income/Expense Accounts and their figures are listed and figured into the calculation to come up with Net Income.
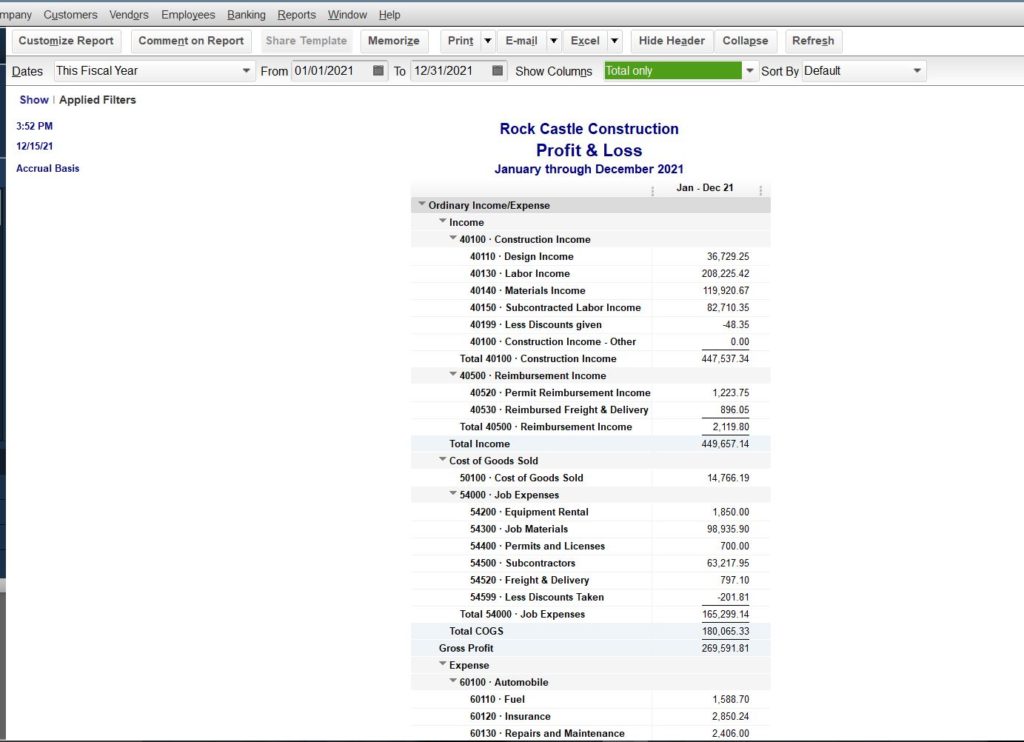
Why is this report important? Most importantly, it shows if your company is profitable. Are you making money or are you losing money? You can quickly see which business activities are bringing income and where you are spending money. You can expand the details of each Income or Expense account to find possibilities to target for reducing spending or increasing income.
If you want to dig a little deeper, select Month from the Show Columns drop box at the top of your viewing screen. Compare monthly income and expense numbers to help with setting budgets and planning for slower months during the year.
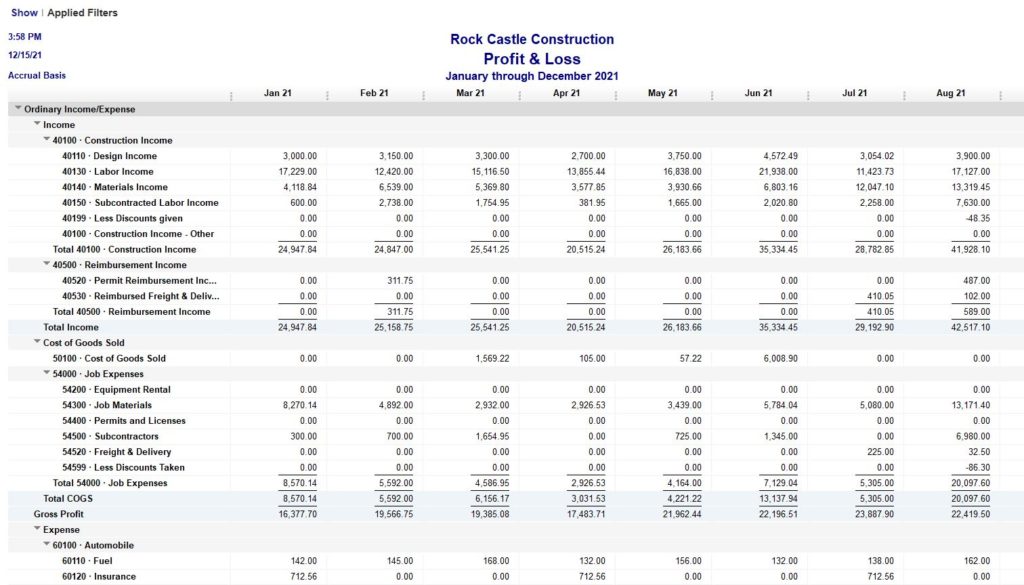
Check carefully from one month to another for significant changes that do not have an obvious reason. If you had a big job one month, it is reasonable to find that your COGS and Expenses would both increase for that month. If not, find out why there is such a discrepancy in the numbers. Look, for instance, at the figures for January and February above. Both months had similar incomes, yet spending on Job Materials was much higher in January than in February. Why? Did you have to use another supplier to get the materials you needed when you needed them, and have to pay higher prices than with your preferred vendor? Did something get booked twice, resulting in a duplicate charge to the expense account?
Look for other indications of items that need a closer look. Did your Liability Insurance rates increase mid-year? Did your phone bill go up? Perhaps you need to shop around to see if you can get a better rate.
The Profit & Loss Report is full of information that can help you see how profitable your company is for any specific period of time. You should study this report to be sure you understand where your money is coming from and where it is going. Use the information to help you make budgets, forecasts, and changes in spending. Keep up with the financial state of your business so that you can make changes when needed. Ask your bookkeeping professional to help you decipher the information if you need help, but don’t neglect the financial information about your business.
Note: AccuraBooks is a bookkeeping firm only, so please consult with your C.P.A. for verification and clarification about the contents of this article.